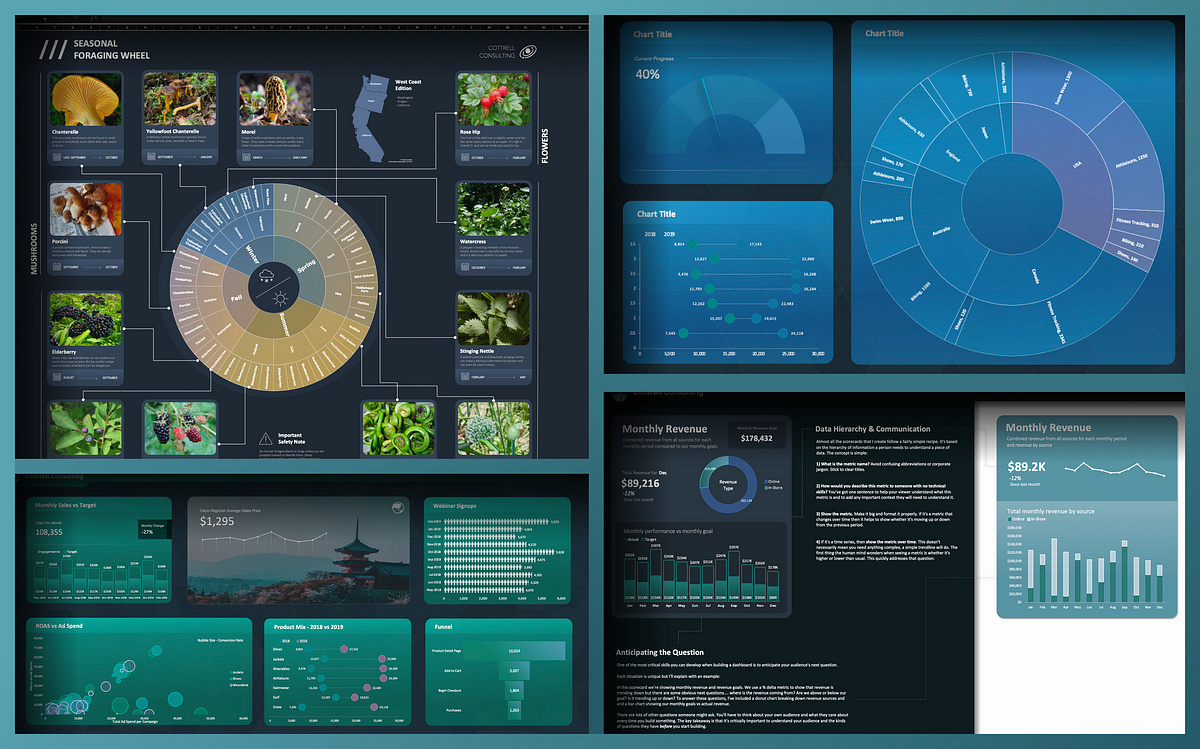
Unlocking Excel's Design Potential: Icons, Colors, and Charts
Core Concepts
Excel offers powerful design tools like icons, colors, and chart customization to enhance visual appeal and uniqueness in reports.
Abstract
Excel provides a free icon set under the 'Insert' tab for users to access. Customizing color palettes and fonts can differentiate reports. Chart styles can be adjusted for better design integration. Utilizing Excel's design features expands project possibilities beyond basic data manipulation.
Customize Summary
Rewrite with AI
Generate Citations
Translate Source
To Another Language
Generate MindMap
from source content
Visit Source
bootcamp.uxdesign.cc
Excel is your most overlooked design tool
Stats
Apps like Excel offer standard colors and fonts by default.
Use a color palette tool like the Adobe Color Picker.
Keep fonts consistent for titles, subheadings, and paragraph text.
Avoid overly stylistic fonts like 'papyrus' or 'comic sans'.
Update chart elements such as axes, legend font colors, fill colors, and borders.
Create beautiful templates in Excel that automatically update with calculations.
Visualize complex visuals like sunburst charts in Excel.
Quotes
Key Insights Distilled From
by Josh Cottrel... at bootcamp.uxdesign.cc 04-19-2022
https://bootcamp.uxdesign.cc/excel-is-your-most-overlooked-design-tool-d5bbae988c92
Deeper Inquiries
How can utilizing Excel's design features impact overall data interpretation?
Utilizing Excel's design features can greatly impact overall data interpretation by making the information more visually appealing and easier to understand. By customizing colors, fonts, and chart styles, you can highlight key data points, create visual hierarchy, and guide the viewer's attention to important insights. This enhanced visual presentation can help users quickly grasp complex information, identify trends or patterns, and make informed decisions based on the data presented.
What are potential drawbacks of deviating from standard color palettes and fonts in reports?
Deviation from standard color palettes and fonts in reports may have some potential drawbacks. One major drawback is inconsistency in branding or messaging if the chosen colors or fonts do not align with established style guides. Using overly unique or unconventional colors/fonts may also lead to readability issues for certain audiences who are accustomed to traditional designs. Moreover, excessive use of different colors/fonts without a cohesive strategy could result in a cluttered or confusing report layout that hinders rather than enhances data comprehension.
How does visual appeal contribute to effective communication of data insights?
Visual appeal plays a crucial role in effective communication of data insights as it helps capture audience attention, engage viewers' interest, and facilitate better retention of information. Well-designed visuals such as charts with clear labels/colors/fonts make it easier for individuals to interpret complex datasets quickly and accurately. Visual elements like icons, infographics, and customized chart styles not only enhance aesthetics but also aid in storytelling by presenting data in a compelling narrative format that resonates with viewers on an emotional level. Ultimately, visual appeal transforms raw numbers into meaningful stories that drive understanding and decision-making based on the communicated insights.
0
