Understanding Machine Learning through Visualization
核心概念
The author explains how computers use statistical learning techniques to identify patterns in data and make accurate predictions, focusing on distinguishing homes in New York from those in San Francisco through machine learning models.
摘要
In this content, the author provides a visual introduction to machine learning by explaining how computers utilize statistical learning techniques to recognize patterns in data. By using a dataset about homes, the author demonstrates how machine learning can be applied to differentiate between homes in New York and San Francisco based on factors like elevation and price per square foot. The content emphasizes the importance of features or variables in a dataset and the concept of drawing boundaries to classify data points accurately.
A visual introduction to machine learning
統計資料
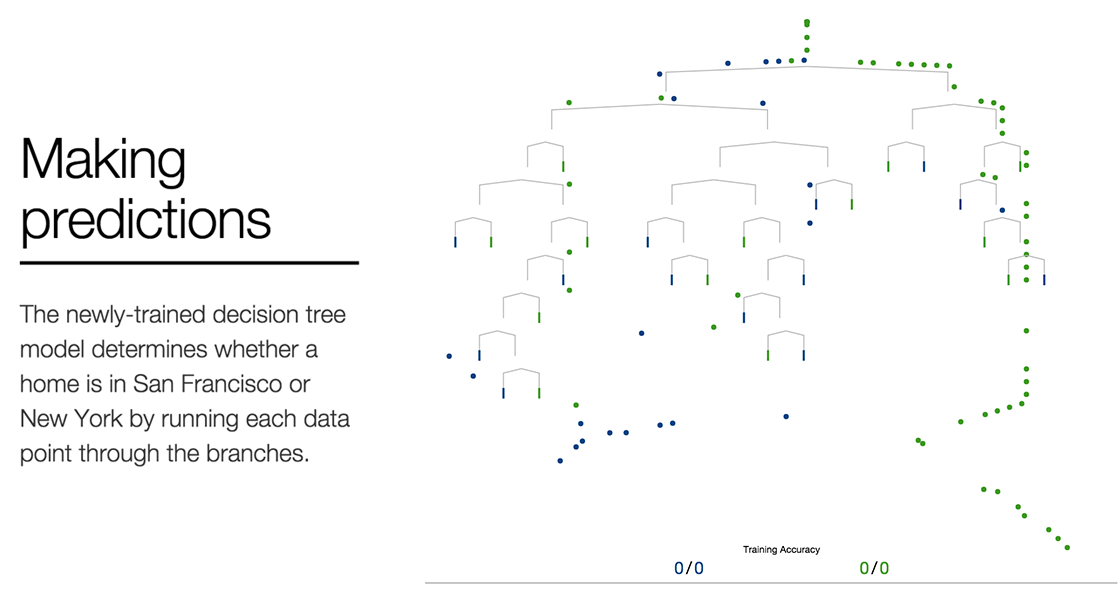
Using a data set about homes, we will create a machine learning model to distinguish homes in New York from homes in San Francisco.
Based on the home-elevation data, a home above 73 meters should be classified as one in San Francisco.
Among homes at or below 73 meters, those that cost more than $19,116.7 per square meter are in New York City.
引述

深入探究
How can machine learning techniques be applied to other real-world scenarios beyond distinguishing between cities
Machine learning techniques can be applied to various real-world scenarios beyond distinguishing between cities. For instance, in healthcare, machine learning algorithms can analyze medical data to predict patient outcomes or identify potential diseases early on. In finance, these techniques can be used for fraud detection by analyzing patterns in transaction data. Additionally, in marketing, machine learning models can personalize recommendations based on user behavior and preferences. The applications of machine learning are vast and diverse, spanning across industries such as retail, transportation, agriculture, and more.
What potential challenges or biases could arise when using elevation and price per square foot as distinguishing factors
When using elevation and price per square foot as distinguishing factors in a machine learning model, several challenges and biases may arise. One challenge is the presence of outliers that could skew the results; for example, extremely high-priced homes or unusually elevated properties may not follow the general pattern of the dataset. Biases could also emerge if certain neighborhoods or types of homes are overrepresented in the data compared to others. This imbalance could lead to inaccurate predictions or reinforce existing stereotypes about specific areas or property types.
How does the concept of drawing boundaries in statistical learning relate to decision-making processes outside of technology
The concept of drawing boundaries in statistical learning is closely related to decision-making processes outside of technology because it involves defining criteria for categorizing information effectively. Just like how a machine learning model sets boundaries based on features like elevation and price per square foot to distinguish between cities, individuals and organizations make decisions by establishing thresholds or guidelines for differentiating options or actions. Whether it's setting financial targets based on revenue projections or determining admission criteria for educational institutions, drawing boundaries helps streamline decision-making processes by providing clear parameters for evaluation and selection.
0
